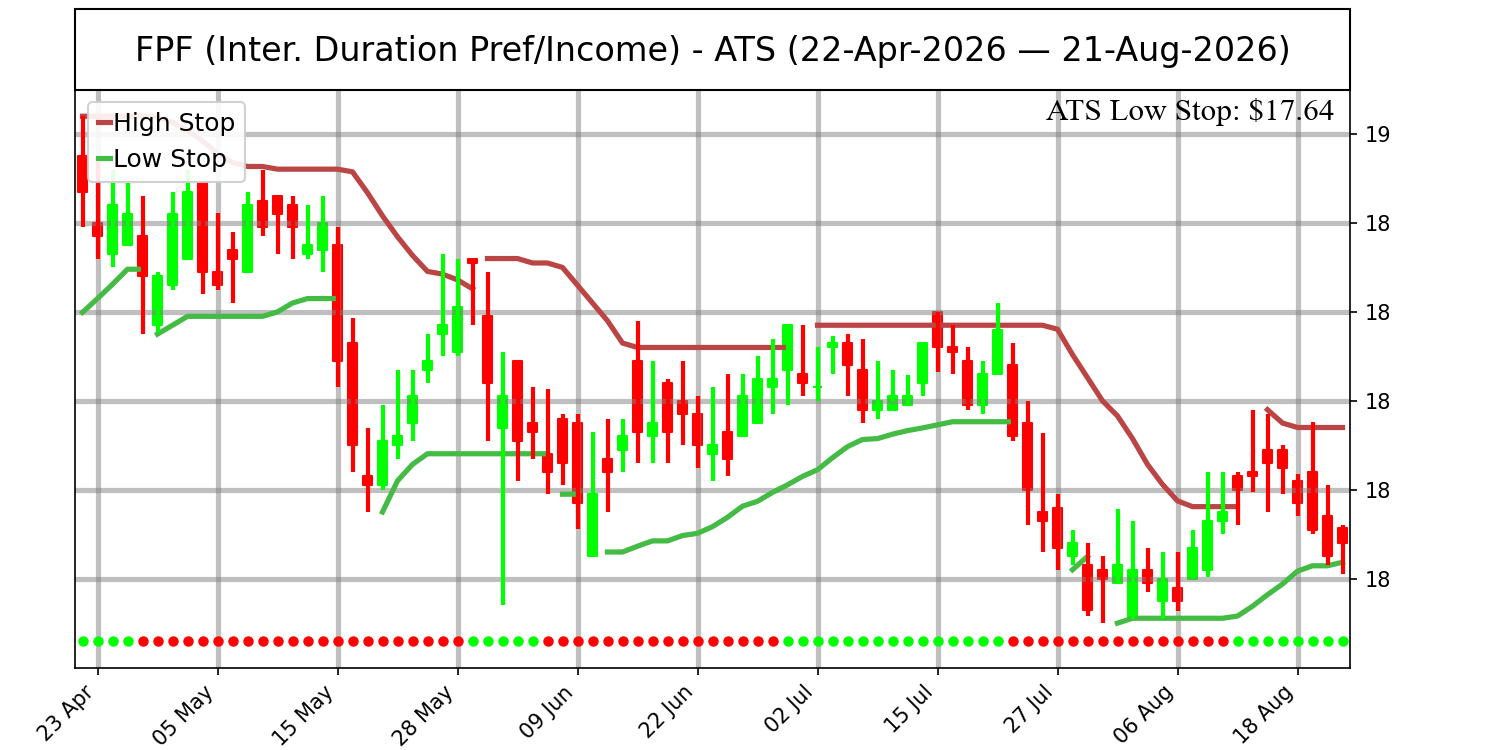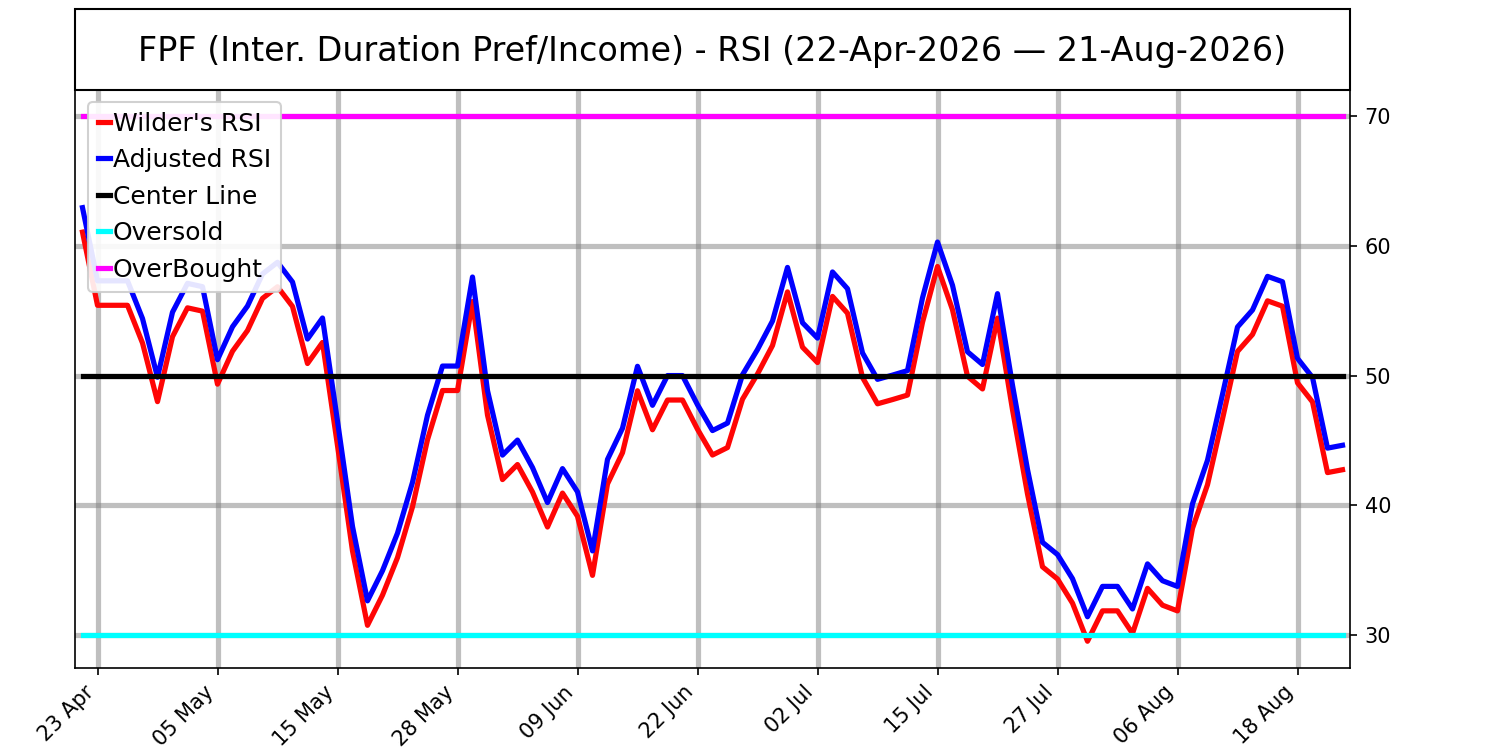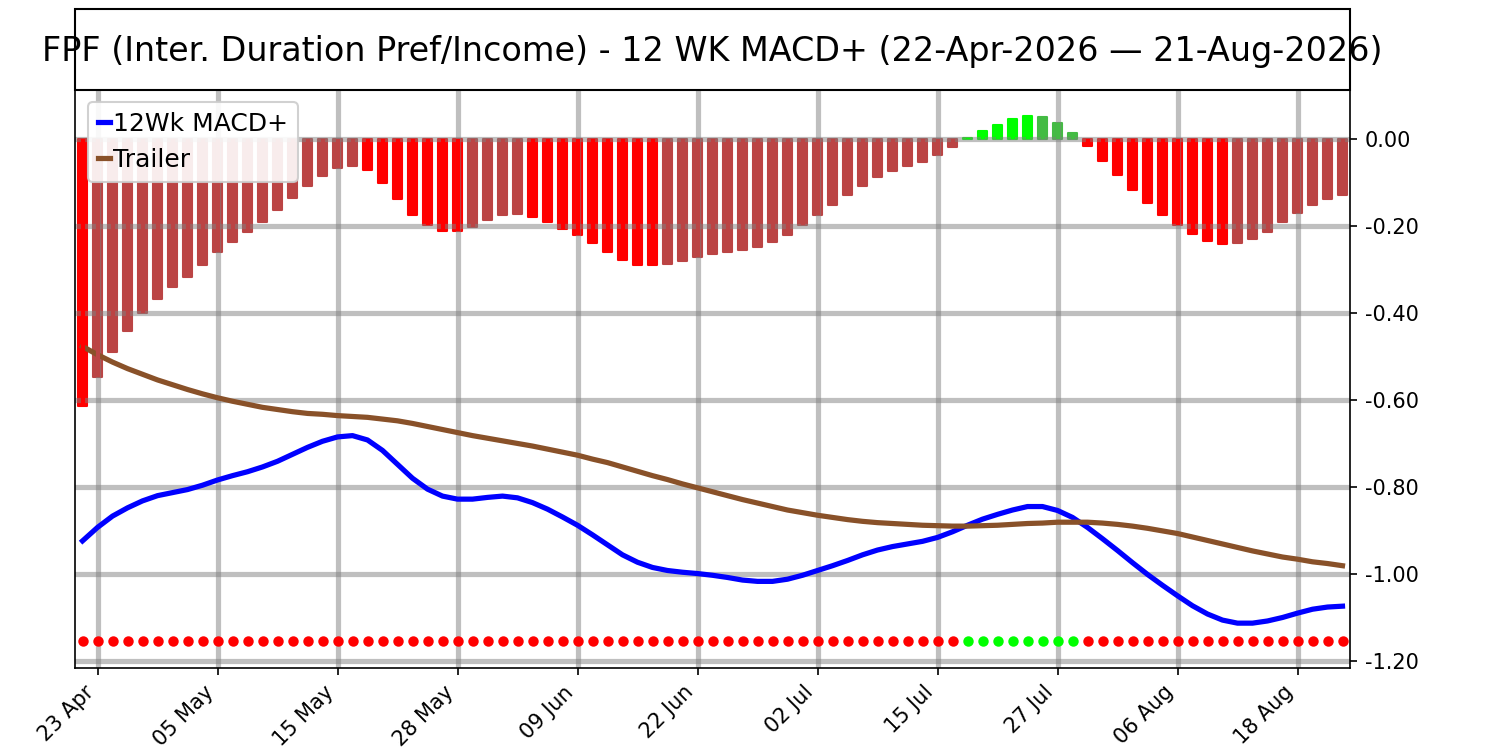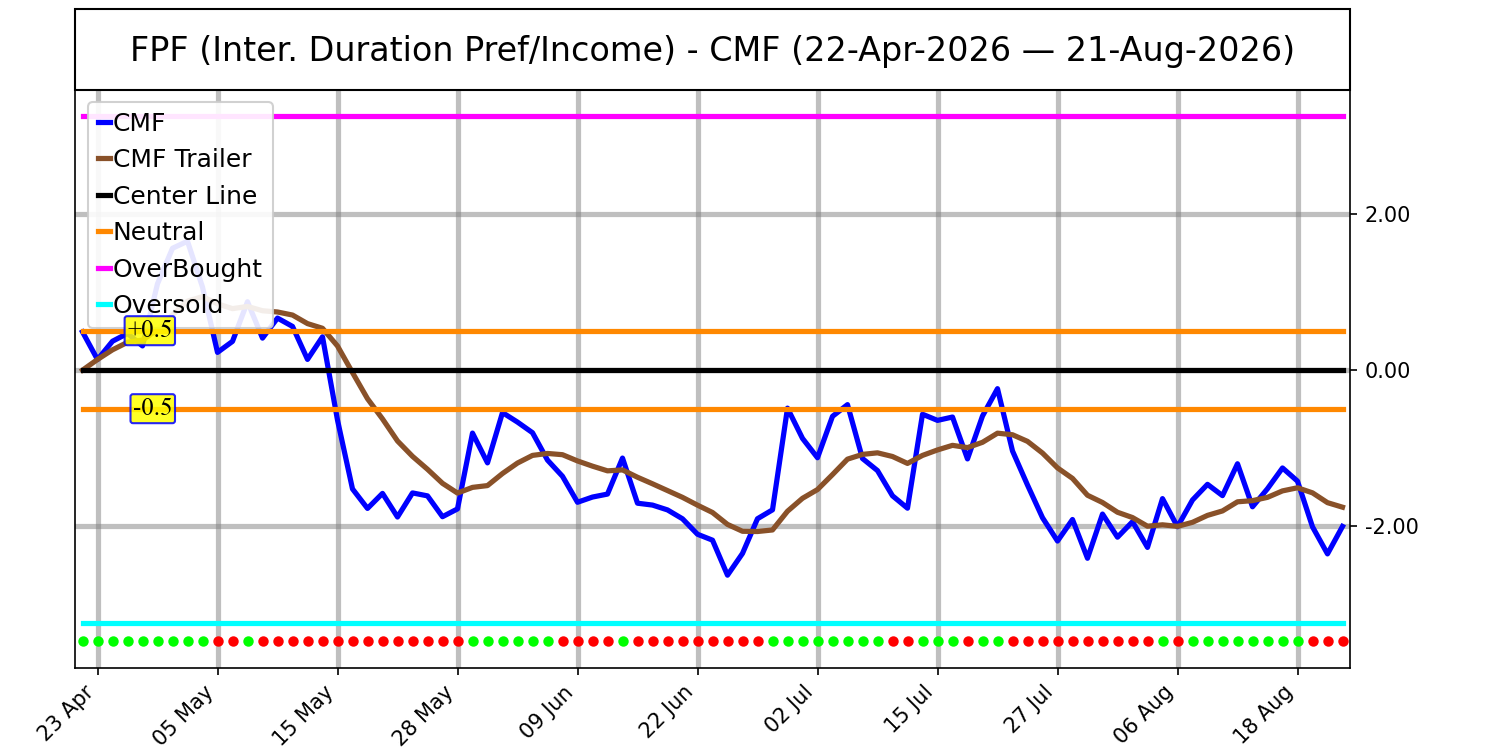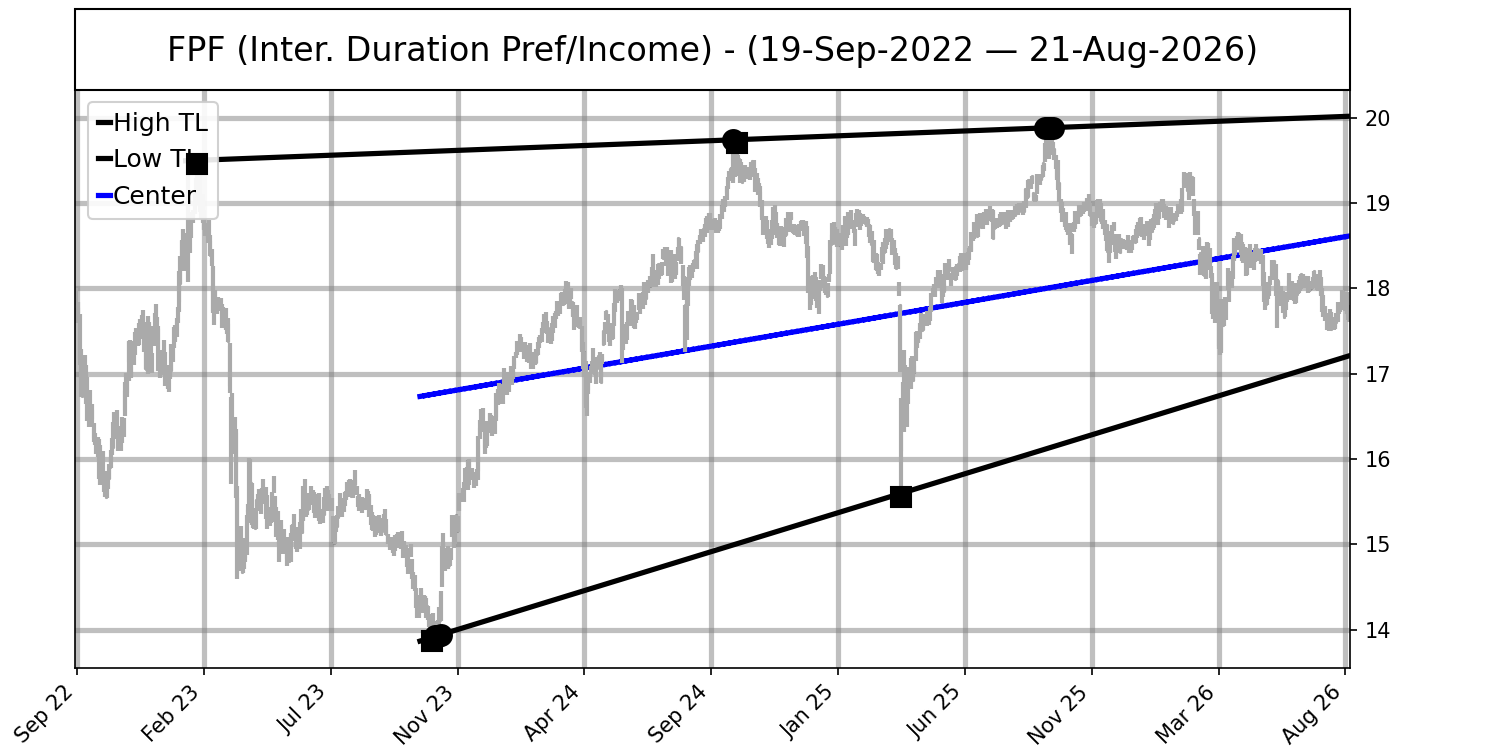
| 142-week converging, upward-sloping channel. High trendline touch score is 2.8. High trendline is currently at $20.02 and tomorrow it will be at $20.02. Low trendline touch score is 2.6. Low trendline is currently at $17.21 and tomorrow it will be at $17.22. Centerline is at $18.61. |
|
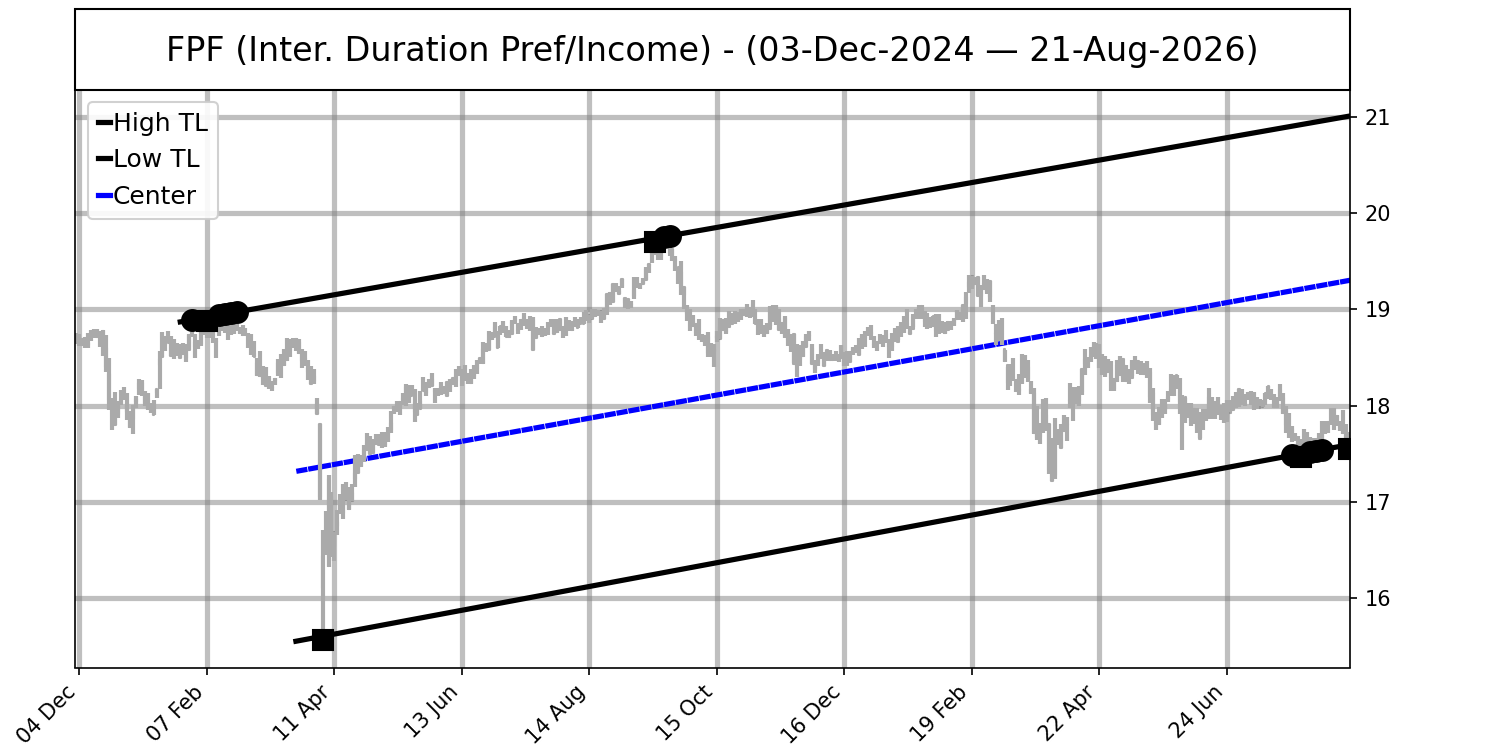
| 69-week rising, well-collimated channel. High trendline touch score is 2.9. High trendline is currently at $21.01 and tomorrow it will be at $21.02. Low trendline touch score is 3.7. Low trendline is currently at $17.59 and tomorrow it will be at $17.60. Centerline is at $19.30. |
|
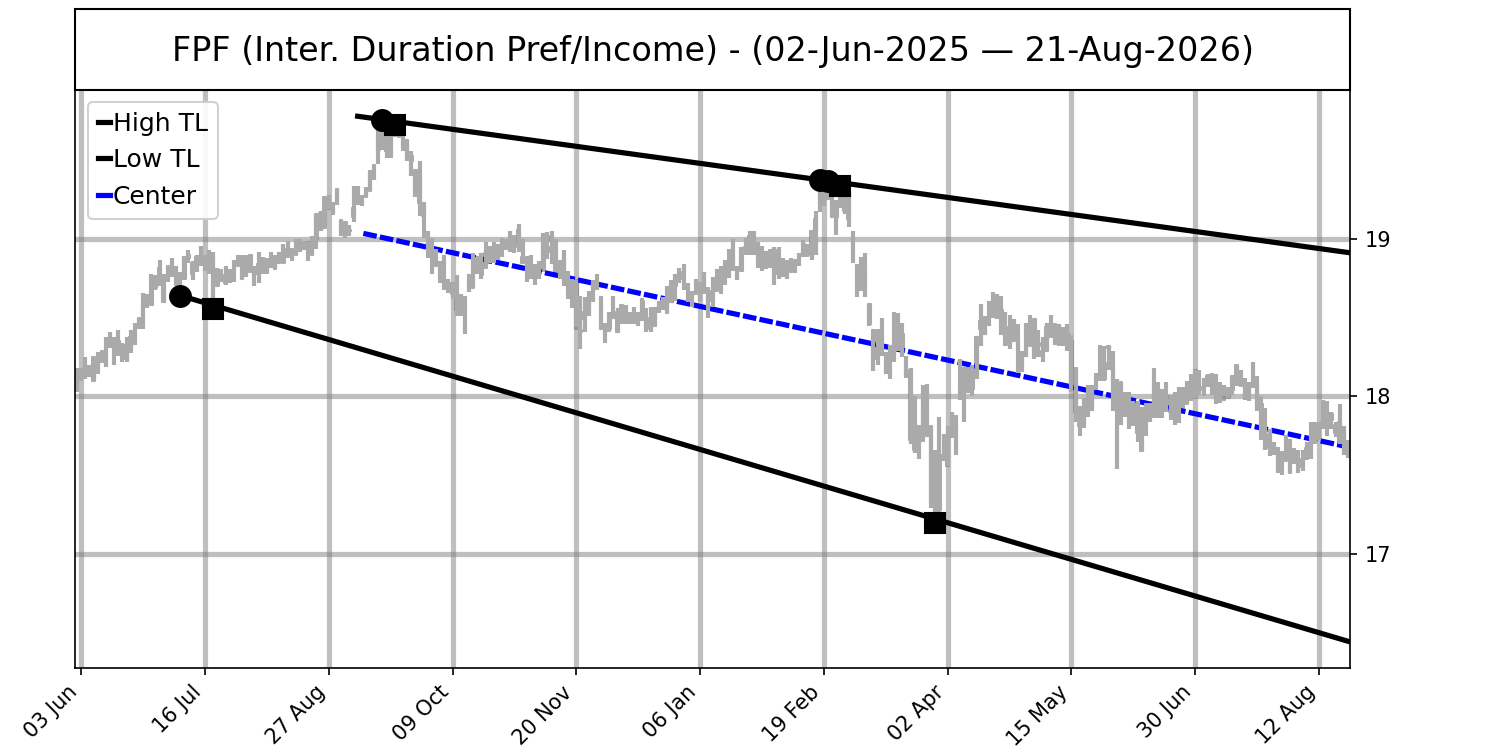
| 46-week falling, diverging channel. High trendline touch score is 2.6. High trendline is currently at $18.92 and tomorrow it will be at $18.91. Low trendline touch score is 2.2. Low trendline is currently at $16.44 and tomorrow it will be at $16.44. Centerline is at $17.68. |
|
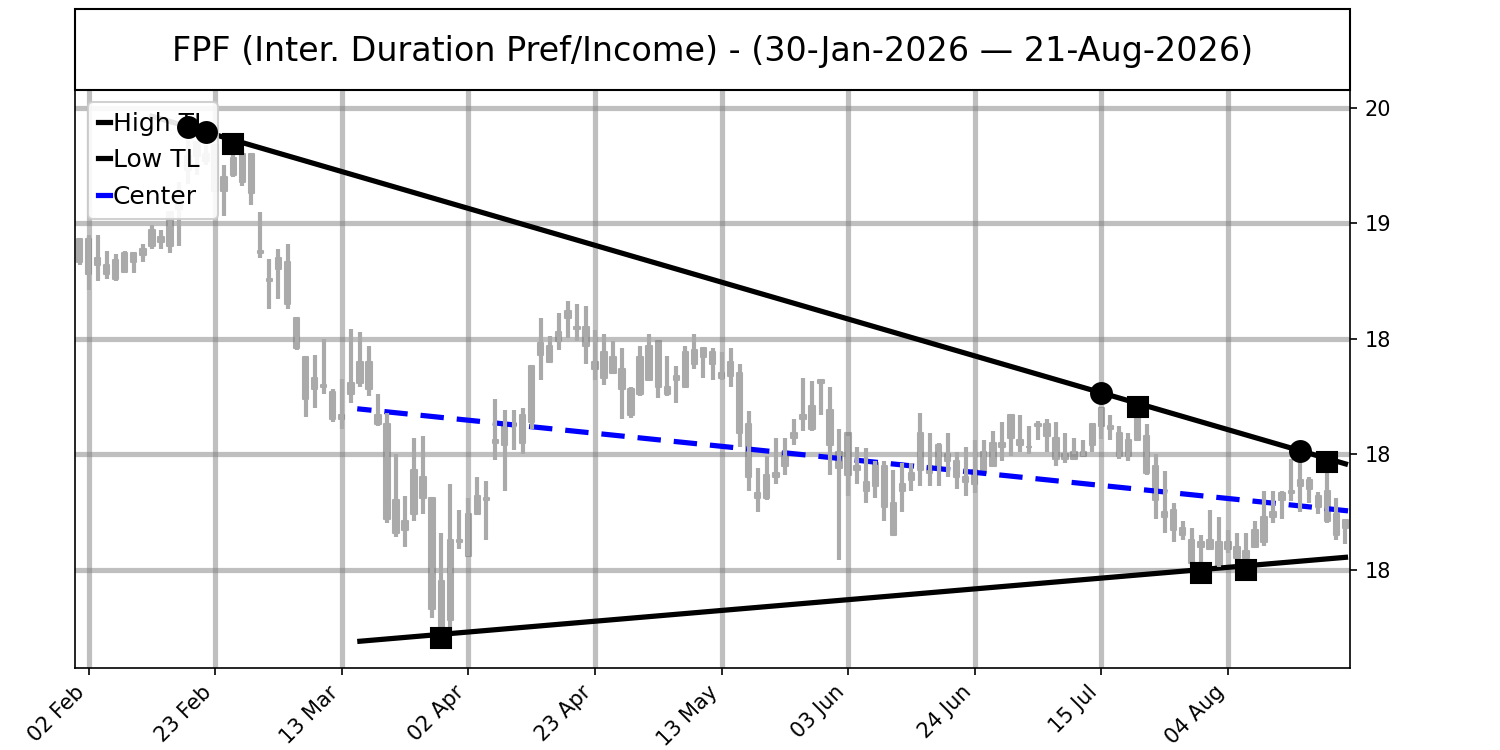
| 20-week converging, downward-sloping channel. Bounce off confirmed high trendline on 19-Aug-2026. High trendline touch score is 3.7. High trendline is currently at $17.96 and tomorrow it will be at $17.95. Low trendline touch score is 3. Low trendline is currently at $17.55 and tomorrow it will be at $17.56. Centerline is at $17.76. |
|
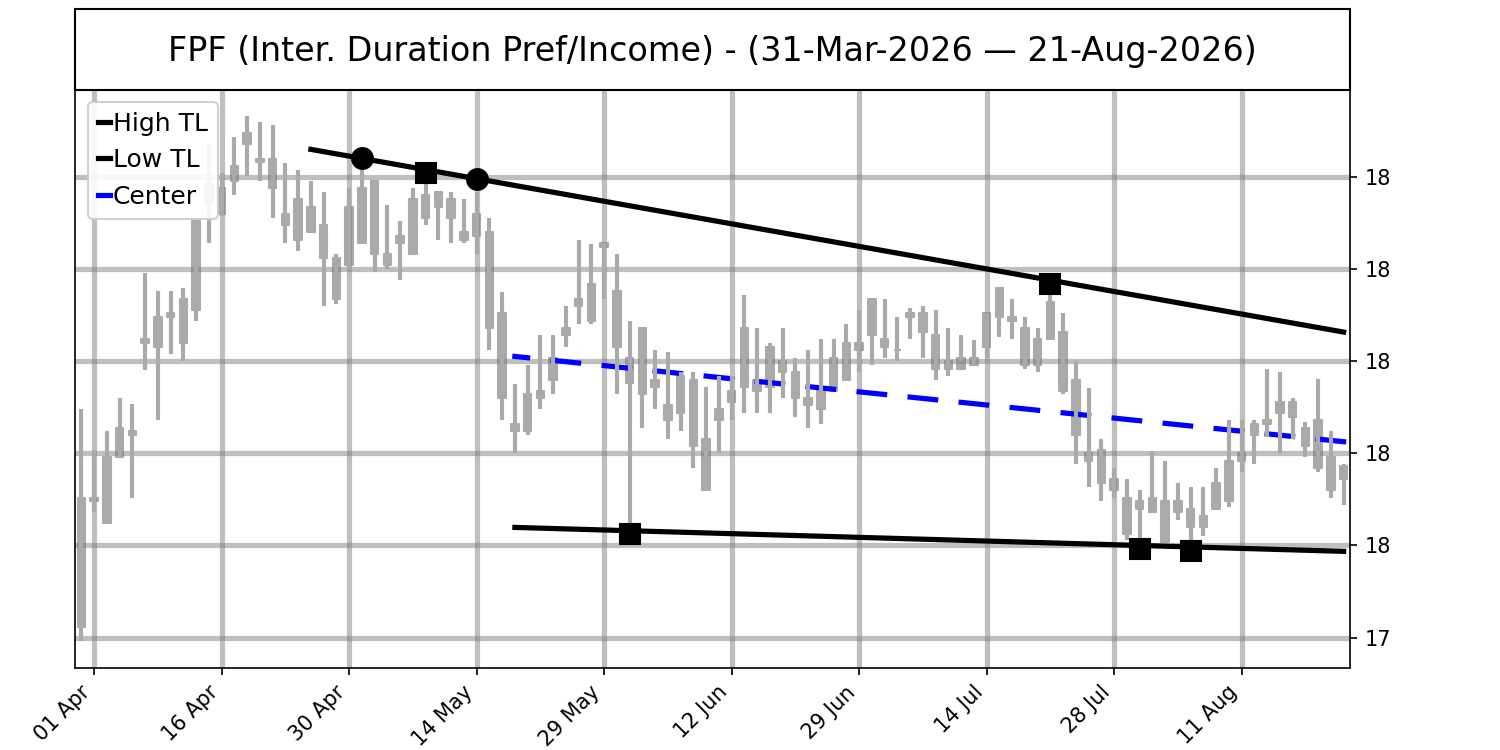
| 11-week converging, downward-sloping channel. High trendline touch score is 2.4. High trendline is currently at $18.08 and tomorrow it will be at $18.07. Low trendline touch score is 3. Low trendline is currently at $17.48 and tomorrow it will be at $17.48. Centerline is at $17.78. |
|
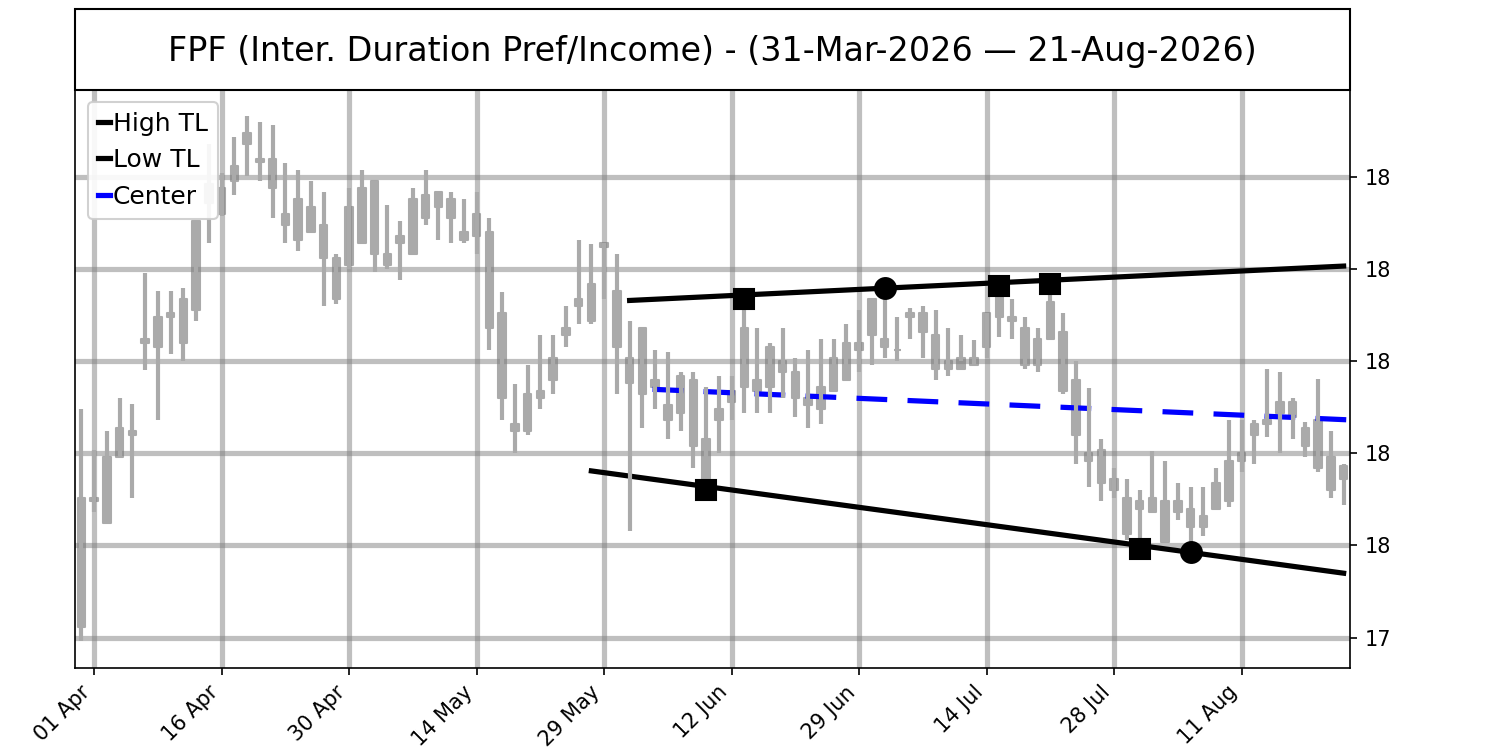
| 9-week diverging, horizontal channel. High trendline touch score is 3.2. High trendline is currently at $18.26 and tomorrow it will be at $18.26. Low trendline touch score is 2.2. Low trendline is currently at $17.42 and tomorrow it will be at $17.42. Centerline is at $17.84. |
|
 FPF
FPF